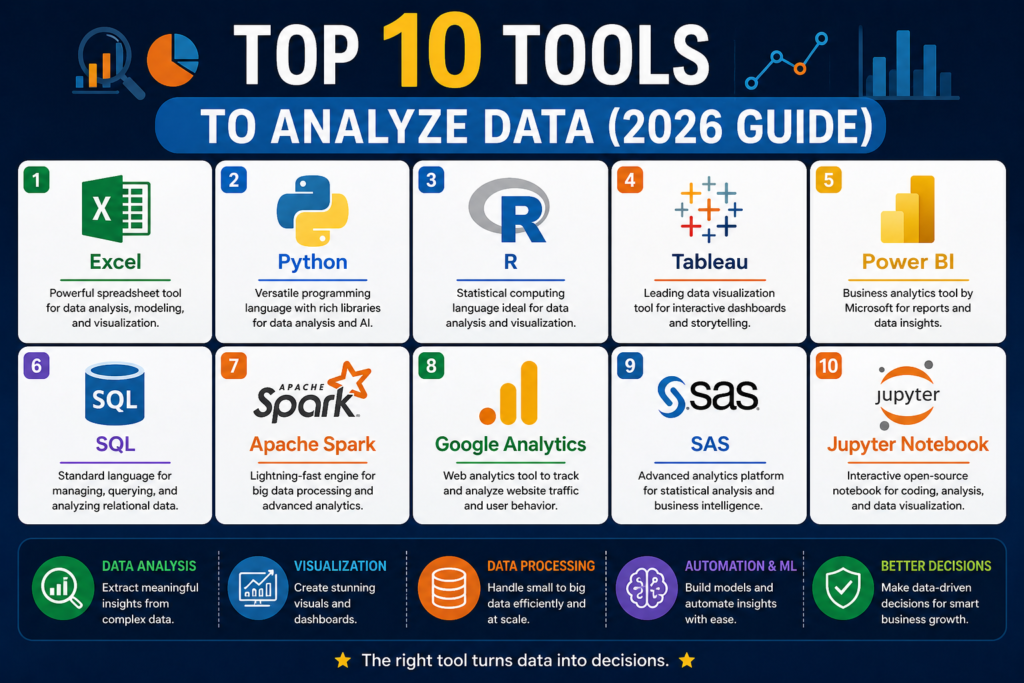
Top 10 Data Analysis Tools (2026 Guide)
+
Table of Contents
- 1 Reasons Data Analysis Tools Are Important
- 2 Tools: Top 10 Data Analysis Tools
- 2.1 1. Microsoft Excel
- 2.1.1 Key Features:
- 2.2 2. Python
- 2.2.1 Key Libraries:
- 2.3 3. R programming language
- 2.4 4. Tableau
- 2.4.1 Key Features:
- 2.5 5. Power BI
- 2.5.1 Key Features:
- 2.6 6. SQL
- 2.6.1 Key Features:
- 2.7 7. Apache Spark
- 2.7.1 Key Features:
- 2.8 8. Google Analytics
- 2.8.1 Key Features:
- 2.9 9. SAS
- 2.9.1 Key Features:
- 2.10 10. Jupyter Notebook
- 2.10.1 Key Features:
- 3 Comparing Top 10 Tools to analyze data at a Glance
- 4 Final Thoughts for Top 10 Tools to analyze data
- 4.1 Frequently Asked Questions (FAQs).
- 4.1.1 Which is the most user-friendly data analysis tool?
- 4.1.2 Which is superior to Excel in data analysis: Python or Excel?
- 4.1.3 What is the most appropriate tool to use in data visualization?
- 4.1.4 Is data analysis required to be coded?
- 4.1.5 Which type of data analysis tool will be the highest in demand in 2026?
- 4.1.6 Is it possible to work with several tools?
- 4.1.7 What is the most appropriate tool for big data?
- 4.1.8 Does Google Analytics suffice to perform data analysis?
- 4.1.9 What is SQL used to do to analyze data?
- 4.1.10 What is the first tool that should be mastered by students?
The analysis of data has become a central feature of any business, including marketing and finance, or healthcare and technology. Regardless of having small data or enterprise-scale data pipelines, the appropriate tools can increase efficiency, accuracy, and insights by orders of magnitude.
This guide will deconstruct the top 10 tools for data analysis, their characteristic features, applications, pros, and cons, enabling you to pick the appropriate stack to use with your workflow.
Reasons Data Analysis Tools Are Important
The new data analysis is not simply about numbers; it is about drawing actionable insights. The appropriate tools assist you in:
- Wash up and convert raw data
- Perform statistical and predictive analysis
- Visualize patterns and trends
- Automate workflows
- Collaborate across teams
The tools below will accommodate all levels of expertise, from beginners to advanced analysts.
Also Read- Future Gadgets That Will Change Your Life
Tools: Top 10 Data Analysis Tools
1. Microsoft Excel
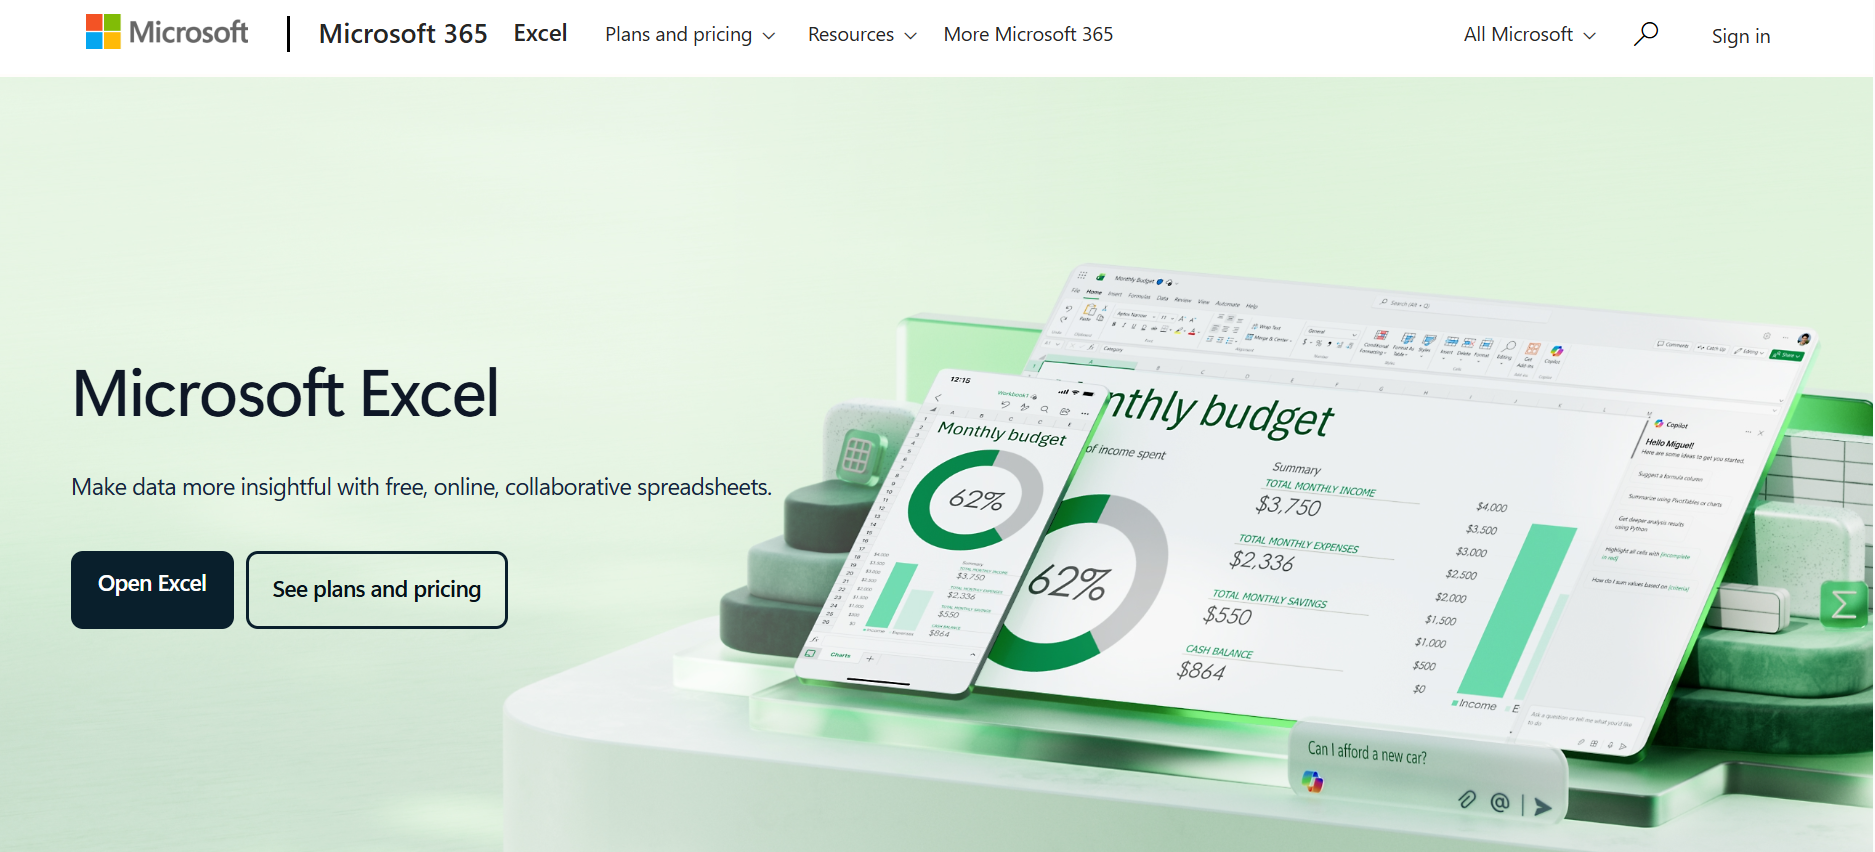
Excel is one of the data analysis tools that is still mostly used worldwide.
Key Features:
- Pivot tables
- Formulas and functions
- Data drawing (graphs, charts)
- Power Pivot and Power Query
Best: for beginners and business people.
Limitations: Not best with large datasets or automation.
Excel Data analysis usually begins with Excel and has a role in providing a quick insight and reporting.
2. Python
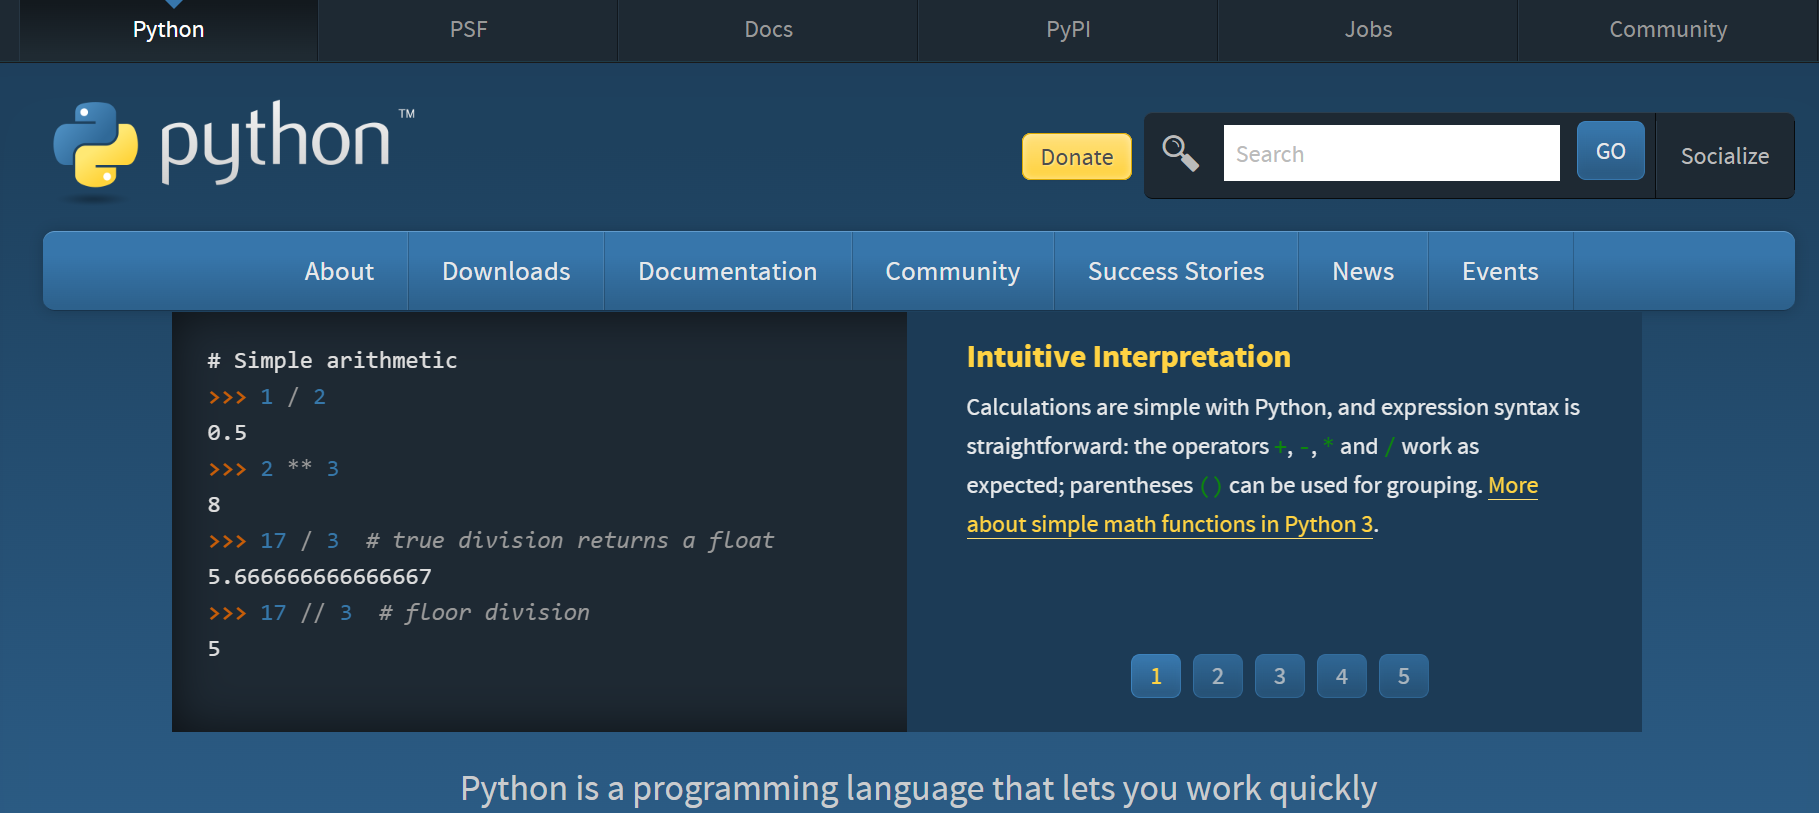
Python has emerged as the foundation of data science today.
Key Libraries:
- Pandas (data manipulation)
- NumPy (numerical computing)
- Matplotlib & Seaborn (visualization)
- Scikit-learn (machine learning)
Best For: Full-scale analytics, automation, and machine learning.
Cautions: Must have knowledge of coding.
Python is very scalable and is massively applicable in analytics, A.I., and automation.
3. R programming language
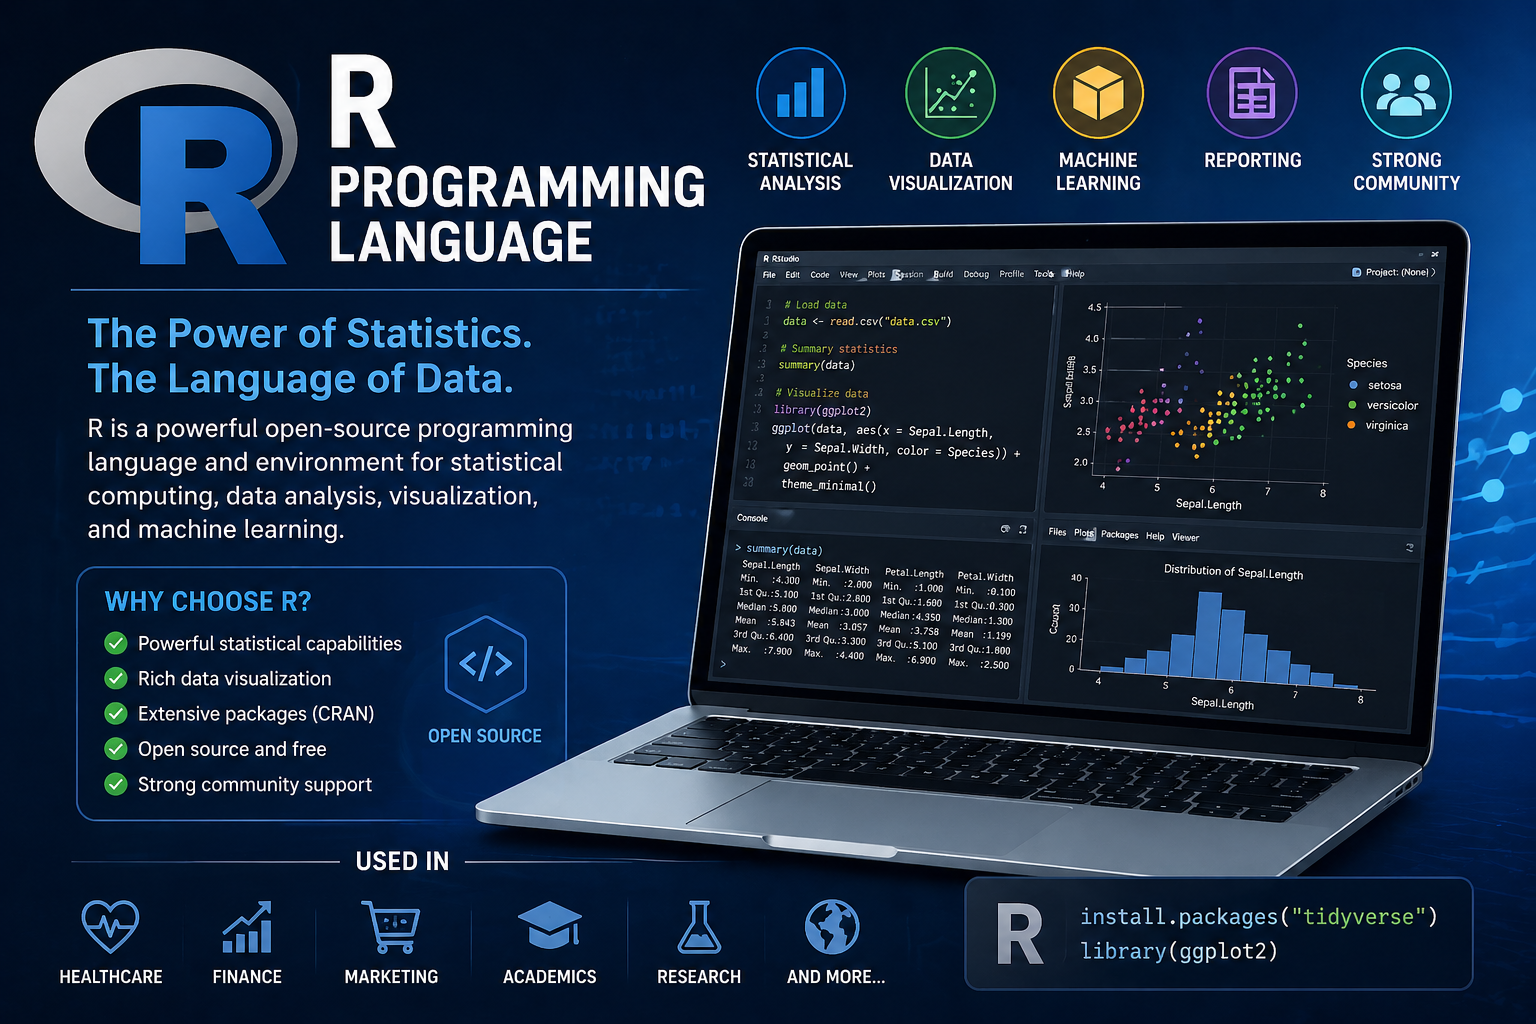
R can be used particularly to facilitate a statistical analysis and visualization of data.
Key Features:
- Advanced statistical modeling
- Graphics Packages: ggplot2 and dplyr.
- Good scholarly and research use.
Best To: Statisticians, researchers.
- Shortcomings: Steeper learning curve for non-programmers.
- R is proficient in statistical analysis and intricate modelling.
4. Tableau

Tableau is the most attractive tool for developing interactive dashboards.
Key Features:
- Drag-and-drop interface
- Real-time data visualization
- Connection with various data points.
Best Use: Business intelligence and dashboards.
Limitations: Small team use is costly.
Tableau converts complicated data into insights that are easy to understand and are achieved with minimal coding.
5. Power BI
Power BI, which was developed by Microsoft,t is a very strong contender to Tableau.
Key Features:
- Easy connection with Excel and Azure.
- Interactive dashboards
- AI-powered insights
Best Lovers: Enterprises and the Microsoft ecosystem users.
Limitations: Slowness when using large datasets.
Power BI is affordable and is used extensively in the business world.
6. SQL
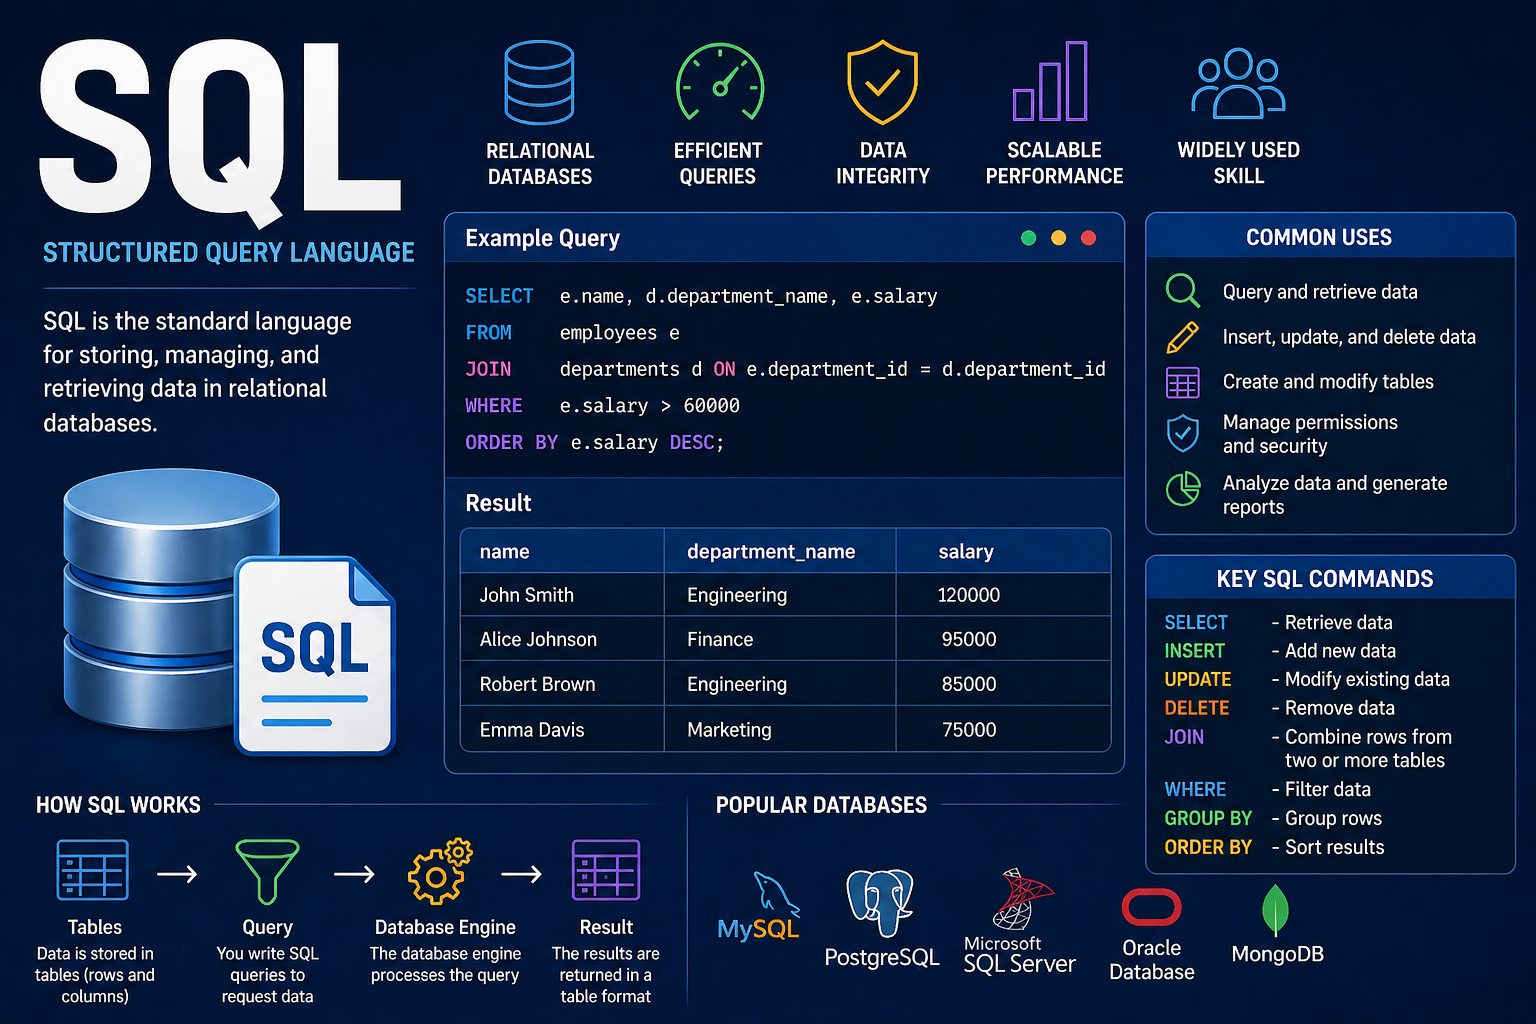
SQL (Structured Query Language) is critical in dealing with databases.
Key Features:
- Data mining and data engineering.
- Query optimization
- Works with relational databases
Best For: Model extraction and back office analysis.
Limitations: Not a visual tool.
SQL is required by virtually all data analysts to work with structured data.
7. Apache Spark
Spark can be used in large-scale processing of data.
Key Features:
- Fast distributed computing
- Real-time data processing
- Python, Scala, and Java are supported.
Best Use: Big data and real-time analytics.
Shortcomings: Needs technical knowledge.
Applied to companies that deal with large volumes of data, such as streaming services and Fintech.
8. Google Analytics
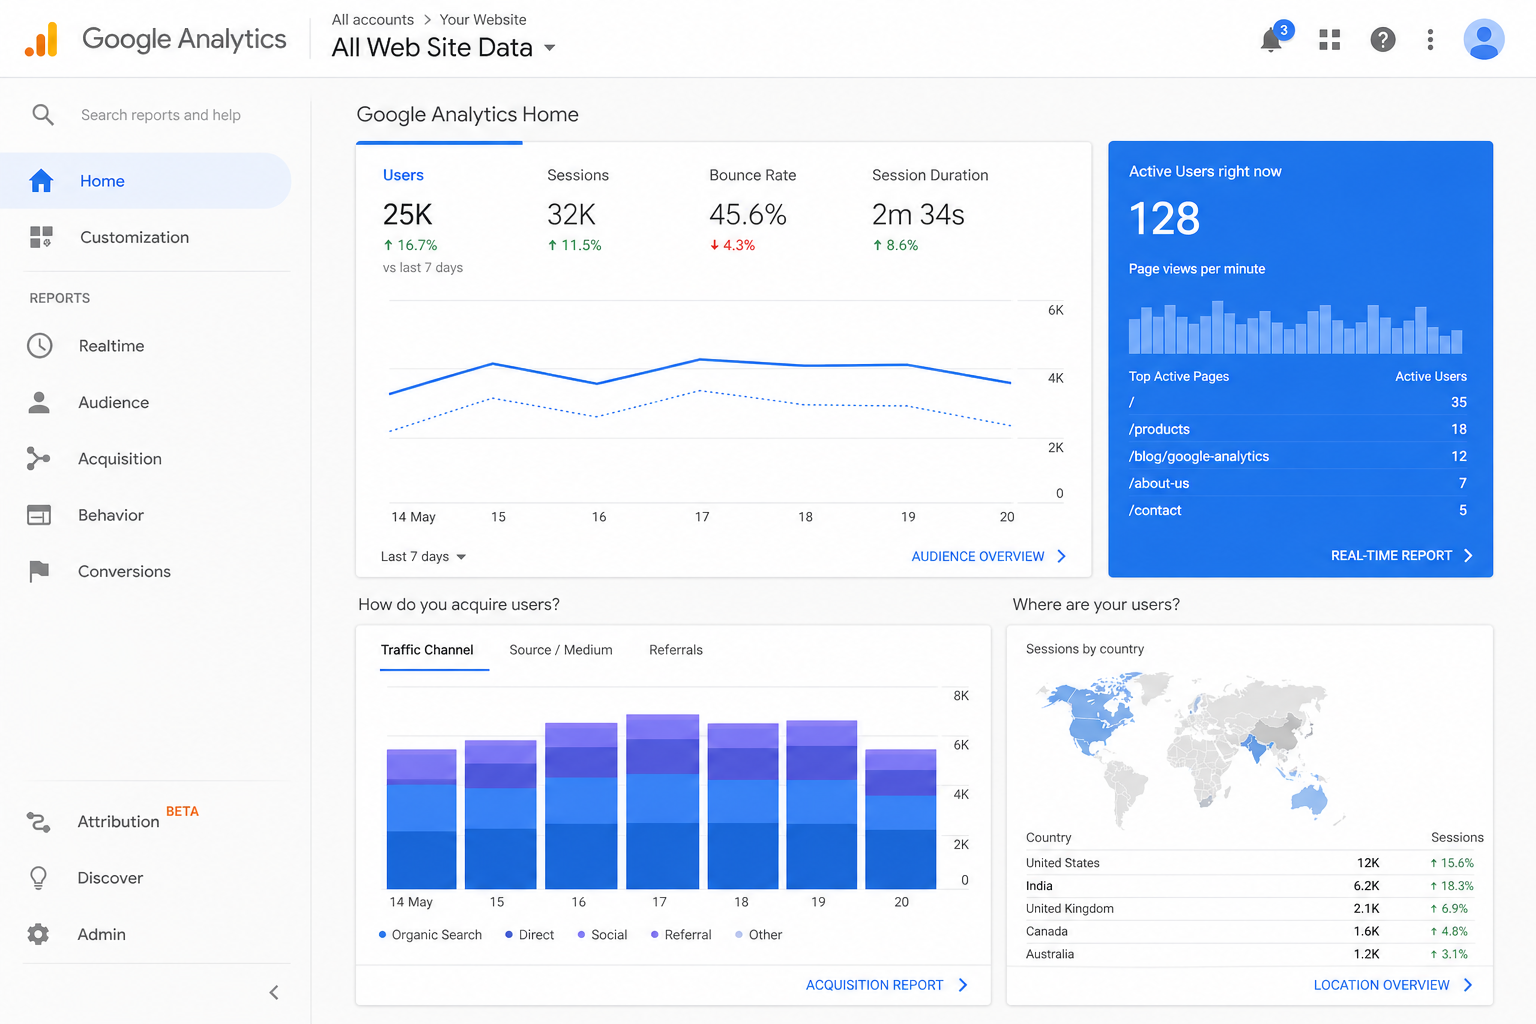
Google Analytics is necessary for performance monitoring of the websites.
Key Features:
- User behavior tracking
- Traffic analysis
- Conversion metrics
Best For: Web analytics and online marketing.
Weaknesses: Weak on deep data modeling.
It is an indispensable resource for marketers and content creators.
9. SAS

SAS is a strong business-level analytics software.
Key Features:
- Advanced analytics
- Predictive modeling
- Data management
Best For: Finance, healthcare, and enterprises.
Limitations: Costly and not as versatile.
In very regulated industries, SAS is relied on to have strong analytics.
10. Jupyter Notebook
Jupyter Notebook is popular as a data analysis tool.
Key Features:
- Fuses code, graphics, and text.
- Is superior to Python, R, etc.
- Ideal for experimentation
Advised: Data scientists and learners.
Limitations: Not suitable for production systems.
It is ideal for investigating datasets and creating prototypes.
Comparing Top 10 Tools to analyze data at a Glance
| Tool | Good at | Skill Level | Strength |
|---|---|---|---|
| Excel | Basic analysis | Novice | Simple to use |
| Python | Advanced analytics | Advanced | Flexibility |
| R | Statistical modeling | Advanced | Deep statistics |
| Tableau | Visualization | Intermediate | Dashboards |
| Power BI | Business analytics | Semi-advanced | Reporting & insights |
| SQL | Database querying | Intermediate | Database manipulation |
| Apache Spark | Big data | Intermediate | Scale & speed |
| Google Analytics | Web data | Intermediate | Marketing insights |
| SAS | Enterprise analytics | Advanced | Reliability |
| Jupyter Notebook | Experimentation | Intermediate | Interactive analysis |
Calculating brain: How to Select the Right Tool
The correct tool will depend on your objectives:
- Novices: Unleash with Excel or Google Analytics.
- Business workers: Tableau or Power BI.
- Developers/mind scientists: Python, SQL, Jupyter
- Apache Spark professionals: big data.
- Researchers: S or RAS.
In reality, the vast majority of professionals do not apply only one too;, but they use a combination of them.
Final Thoughts for Top 10 Tools to analyze data
There is no “one-size-fits-all” solution in data analysis. The optimal tool will hinge on your:
Data size
Technical skills
Industry
Budget
To provide an example, a user with access to the analysis of traffic on a website would use Google Analytics, whereas a data scientist who could create predictive models would use Python and Jupyter.
Starting anew, go with Excel + SQL + Python- this is a combination that includes most of what you will be doing in the field.
Frequently Asked Questions (FAQs).
-
Which is the most user-friendly data analysis tool?
The initial point of use would be Microsoft Excel because it is easy and accessible.
-
Which is superior to Excel in data analysis: Python or Excel?
Yes, when it comes to sophisticated work and automation, Python can win over Excel.
-
What is the most appropriate tool to use in data visualization?
Tableau and Power bi are the best when it comes to interactive dash boards.
-
Is data analysis required to be coded?
Not always. Software such as Excel and Tableau do not need much or no code.
-
Which type of data analysis tool will be the highest in demand in 2026?
Python continues to be the most sought-after because of the versatility.
-
Is it possible to work with several tools?
Yes, the combination of SQL and Python and BI tools is most likely to be used by most specialists.
-
What is the most appropriate tool for big data?
Apache Spark is best suited to deal with big data.
-
Does Google Analytics suffice to perform data analysis?
It is agile with web analytics but wimpy when it comes to general data analysis processes.
-
What is SQL used to do to analyze data?
Data is extracted and managed with the help of SQL.
-
What is the first tool that should be mastered by students?
Begin with Excel, and proceed to SQL and Python.